TRUSTMARK (TRMK)·Q4 2025 Earnings Summary
Trustmark Posts Record Year, Raises Dividend 4.2%, Stock Falls 7% After Hours
January 28, 2026 · by Fintool AI Agent
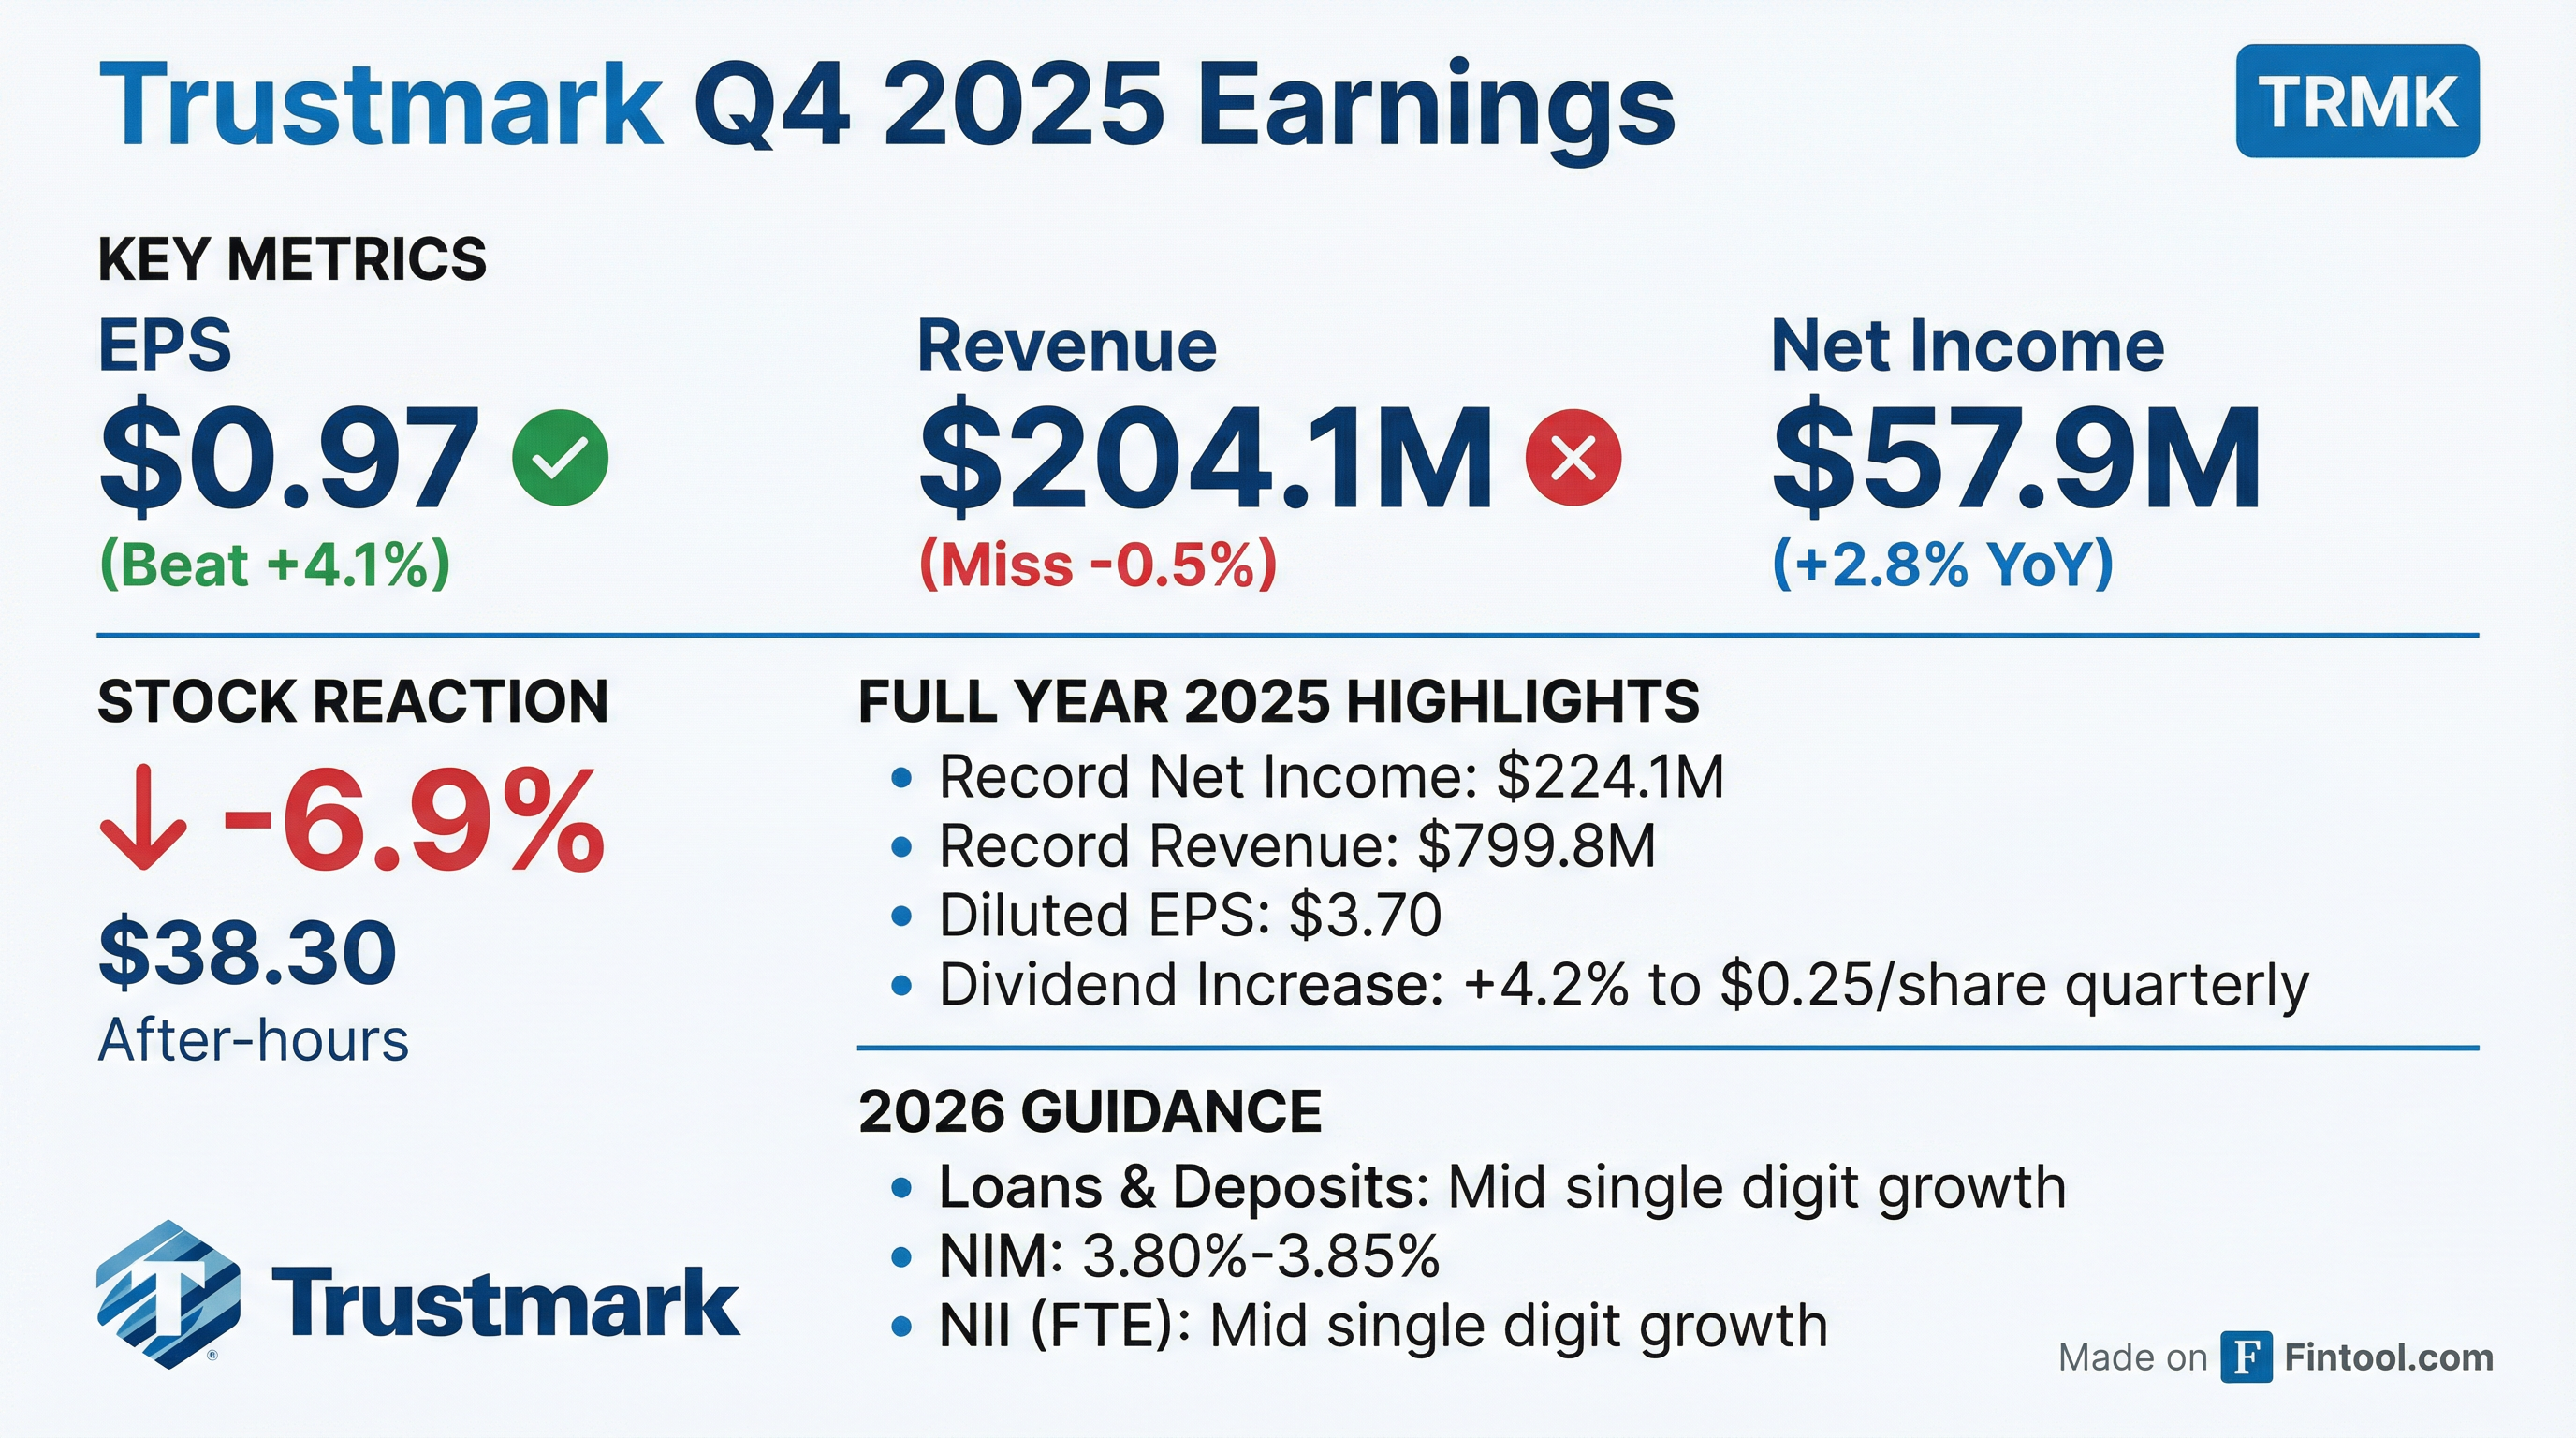
Trustmark Corporation (NASDAQ: TRMK) delivered Q4 2025 results that beat on EPS but narrowly missed on revenue, capping off a record year for the Mississippi-based regional bank. Despite posting record annual net income of $224.1 million and raising its quarterly dividend 4.2%, shares fell approximately 7% in after-hours trading to $38.30.
Did Trustmark Beat Earnings?
Trustmark beat EPS estimates but missed slightly on revenue:
The quarterly results extended an impressive streak of execution. For full-year 2025, Trustmark achieved:
- Record net income: $224.1 million (+374% YoY from adjusted continuing ops)
- Record revenue: $799.8 million
- Diluted EPS: $3.70 (up from $3.04 adjusted in 2024)
- ROAA: 1.21% vs 1.01% adjusted prior year
- ROATE: 12.97% vs 12.71% adjusted prior year
How Did the Stock React?
Despite beating EPS and achieving record results, TRMK shares fell sharply after hours:
The negative reaction likely reflects several concerns embedded in the quarter despite headline beats.
What Changed From Last Quarter?
Net Interest Margin Compression
NIM declined 2 basis points to 3.81% from 3.83% in Q3, driven by accelerated amortization of capitalized costs related to a 2020 subordinated debt refinancing.
Credit Quality Mixed Signals
Net charge-offs spiked to $7.6 million in Q4, but this included a single $5.9 million charge-off on an individually analyzed loan that was already reserved for in prior periods. Excluding this, underlying credit trends remain solid:
- Full-year NCOs: $17.5M or 0.13% of average loans
- ACL coverage: 1.15% of loans HFI
- Nonaccrual loans: $84M (flat QoQ)
- NPAs/Total Loans + ORE: 0.65%
Deposit Pressures
Deposits declined $131.2 million (-0.8%) linked-quarter to $15.5 billion, driven by:
- Public fund runoff: Down $219.1M (-11.0% QoQ)
- Noninterest-bearing DDA: Down $285M
- Partially offset by: Interest checking up $223M
Cost of deposits improved to 1.72% (down 12 bps QoQ), reflecting disciplined deposit pricing in a lower rate environment.
What Did Management Guide?
Trustmark provided qualitative 2026 guidance pointing to continued growth across all major categories:
The "normalizing" credit provision language suggests management expects higher loan loss provisions ahead, which may have spooked investors despite solid current credit metrics.
Capital Return Highlights
Trustmark returned substantial capital to shareholders in 2025:
Dividend Increase
The Board announced a 4.2% dividend increase to $0.25 per share quarterly (up from $0.24), raising the annual dividend to $1.00 per share. Payable March 15, 2026 to shareholders of record March 1, 2026.
Share Repurchases
- Q4 2025: Repurchased ~1.1M shares for $43.0M
- Full-year 2025: Repurchased 2.2M shares (~3.5% of outstanding) for $80.0M
- Shareholder return ratio: 61.8% of net income returned via dividends and buybacks
- 2026 authorization: New $100M repurchase program through December 31, 2026
Capital Position
Capital ratios remain well above regulatory minimums:
Loan Portfolio Deep Dive
Loans HFI grew $126.1 million (+0.9%) QoQ to $13.7 billion, with diversified growth across categories:
CRE Exposure
Commercial real estate totals $5.1B with limited office exposure:
- Office CRE: Just 1.7% of total loans ($228M)
- Multi-family: 40% of CRE portfolio ($2.1B)
- Construction/Land: 22% of CRE portfolio ($1.1B)
- Office delinquencies: Only 0.07% of office portfolio
Noninterest Income Trends
Noninterest income rose 3.3% linked-quarter to $41.2 million:
Wealth Management revenue reached record levels at $40.1 million for full-year 2025 (+7.7% YoY), while mortgage banking recovered to $33.1 million (+24.2% YoY).
Q&A Highlights
Capital Deployment Clarity
CFO Tom Owens provided specific guidance on the $100M buyback authorization: "A range of $60M-$70M is what would essentially keep our capital ratios where they are" at the current 11.72% CET1 level. Deploying the full $100M would take CET1 to ~11.5%, while no buybacks would push CET1 above 12% by year-end.
Credit Guidance Specifics
CCO Barry Harvey quantified the "normalizing" credit guidance: net charge-offs expected at 13-15 bps of average loans, with provisioning at 14-18 bps. Criticized loans fell $181M and classified loans dropped $57M during 2025, and if this improvement continues, provisioning could come in at the lower end.
M&A Posture
CEO Duane Dewey outlined M&A parameters while emphasizing organic growth focus:
- Target size: $1B-$10B in assets
- Target markets: Houston to Dallas, Arkansas, Louisiana, Tennessee
- Stance: "We're not gonna be focused on doing a deal. We're focused on our organic strategy... if a M&A opportunity presents itself in a good market that provides talent, that provides market opportunity, and so on, then we will take advantage of that."
Recent regional bank M&A (Synovus, Pinnacle, Cadence, Stellar) creates organic hiring opportunities that may preclude M&A activity.
Deposit Cost Trajectory
Deposit costs guided to decline from 1.72% to 1.61% in Q1 2026. As of mid-January, deposits were running at 1.63%, with CD repricing expected to drive further improvement.
Hiring Momentum
Trustmark added 13 new production hires in Q4 across all markets and disciplines, following 21 production hires in Q3. The C&I team and equipment finance group are showing improved performance from these investments.
Key Risks to Monitor
- Deposit competition: Public fund outflows and continued pressure on noninterest-bearing deposits
- Credit normalization: Provisioning expected at 14-18 bps vs 13 bps in 2025
- NIM trajectory: While guided stable at 3.80-3.85%, loan yield compression from Fed cuts could pressure margins
- Rate sensitivity: 52% variable-rate loan mix creates Fed rate sensitivity, though hedged with $875M notional in swaps/floors
The Bottom Line
Trustmark delivered a strong Q4 with EPS beating by 4% and capped off a record 2025 with $224.1M in net income. The 4.2% dividend increase and new $100M buyback authorization signal management's confidence. However, the 7% after-hours decline suggests investors are focused on:
- Slight revenue miss and NIM compression
- Management's "normalizing" credit provision guidance
- Continued deposit pressures, particularly in public funds
For a regional bank trading at roughly 1.4x tangible book value ($30.28 TBV per share), the execution has been solid, but the market appears concerned about the path forward as rate cuts work through the banking system.
Data sourced from Trustmark Corporation Q4 2025 earnings presentation filed January 28, 2026.
Related: